You turn 65 and one of the first things you do is check how your savings compare to everyone else’s. The number you keep seeing is $609,230. That’s the average retirement account balance for Americans in the 65-to-74 age bracket, and it shows up in a lot of articles as a rough reassurance that things are basically fine.
Most people are nowhere near it. The median balance for that same age group is $200,000, which is the number that actually describes households in the middle. The average gets pulled way up by a relatively small number of retirees with $1 million or more saved, the same way a few very large tables raise the average check at a restaurant even if most people ordered the soup.
$200,000 is the honest comparison point for most people. It’s also where the math gets tight.
Under the 4% withdrawal rule, which is the most widely used guideline for how much you can pull from a retirement portfolio each year without running it into the ground, $200,000 generates $8,000 a year. That’s $667 a month. It’s not a retirement. It’s a car payment and a few trips to the grocery store.
Americans 65 and older spend roughly $60,000 a year on average, covering housing, food, healthcare, transportation, and everything else. Against $8,000 in annual savings withdrawals, your $200,000 nest egg is covering about 13 cents of every dollar you need. Social Security covers the rest. If you don’t have much Social Security coming because you claimed early, had lower lifetime earnings, or spent years out of the workforce, the math gets considerably harder.
This doesn’t mean $200,000 is a catastrophe. Plenty of people are managing a decent retirement on balances in that range. What it means is that savings at this level are a supplement, not a foundation. The foundation, for most Americans, is Social Security.
Social Security is carrying more than most people expect
Image Credit: Shutterstock
The average monthly Social Security retirement benefit was $2,071 in January 2026, or about $24,850 a year. For a couple where both partners receive the average, that’s close to $50,000 annually before touching savings. That’s not lavish, but in a lot of places it covers the basics, particularly if the mortgage is paid off.
The single most consequential thing most people can do before retirement is decide when to claim. Taking benefits at 62 permanently cuts your monthly check by up to 30% compared to claiming at your full retirement age of 67. Waiting until 70 raises it by roughly 8% a year beyond that, which adds up to a meaningfully larger payment for the rest of your life. The breakeven point where delay pays off is typically around your early 80s. Most people who live into their mid-80s come out significantly ahead by waiting.
It isn’t much better among people approaching retirement. About one in five Americans over 50 has nothing saved, and most of that group says they worry they won’t have enough to last through retirement. That worry is well-founded, though Social Security as a safety net is more functional than people realize. It’s nearly universal for Americans over 65, and for someone with modest lifetime earnings, it can replace a meaningful share of what they were living on.
The reason most people arrive at 65 without savings isn’t reckless spending. It’s that they spent their working years at employers that didn’t offer a retirement plan. Workers who get automatically enrolled in a 401(k) participate at dramatically higher rates than workers who have to set up an IRA on their own. Tens of millions of Americans never had that automatic structure, and saving without it, consistently, across a 30- or 40-year career, is hard in practice.
What actually moves the needle if you’re behind
Image Credit: Shutterstock
Two things matter more than almost anything else: when you claim Social Security, and whether you own your home.
Delaying Social Security from 62 to 70 can raise your monthly benefit by 75% or more. For someone who’d receive $1,400 at 62, waiting until 70 can push the check above $2,400. That’s guaranteed income for life, adjusted annually for inflation, that no market downturn can take away. Every year you delay between 62 and 70, you’re locking in a permanent raise for the rest of your life.
Housing is the single biggest expense in retirement, typically around $21,000 a year for households 65 and older. A paid-off home doesn’t show up in your retirement account balance, but it effectively adds $1,750 a month to what you can afford to live on. For a lot of households, that matters more than several more years of contributions would have. And part-time work in early retirement, even $10,000 or $15,000 a year, lets your savings sit longer and draw down more slowly. It’s not the retirement most people picture, but it’s often the difference between money that lasts and money that doesn’t.
Bottom line
Image Credit: Shutterstock
Most 65-year-olds are working with less than $200,000 saved and a Social Security check that has to do more than it was originally designed to do. That’s a tight situation, and it’s the situation most American households are actually in. It’s not comfortable, but it’s manageable for a lot of people, especially with a paid-off home, a realistic spending plan, and the discipline to delay Social Security as long as reasonably possible.
Only 35% of non-retirees say their retirement savings plan feels on track. Most people who feel behind are right about that. What they sometimes underestimate is how much the decisions still in front of them, when to claim, what to spend, whether to work a little longer, can shift the outcome.
That jar of old coins your grandmother kept on the kitchen windowsill. The rubber-banded stack of bills tucked in the back of an estate box. The change that’s been sitting at the bottom of a dresser drawer since your uncle moved into assisted living.
Most of it is worth exactly what it says. But some of it isn’t. Pre-1965 coins are made of silver that’s now worth a multiple of face value. Printing errors and manufacturing mistakes turned ordinary pennies into four-figure collector pieces. A handful of specific bills are worth real premiums to the right buyer, and a few in the wrong condition are worth precisely nothing beyond what you can spend them for.
These 18 pieces of currency range from silver coins you might find in any old collection, banknotes that turn up in estate boxes regularly, die errors that circulated for decades before anyone caught on, and a few aspirational pieces worth knowing about in case you get lucky. Prices are based on what these things actually sell for in their current condition, not asking prices or record highs.
A five-cent coin made of silver sounds wrong, but it happened. During World War II, the government needed nickel for armor plating and artillery, so from late 1942 through 1945 the Mint changed the five-cent piece’s composition to 56% copper, 35% silver, and 9% manganese.
Each war nickel contains about 0.056 troy ounces of silver, putting the current melt value around $3 to $4, which is 60 to 80 times face value. Identification is easy: look at the back of any 1942-1945 nickel. On standard Jefferson nickels, the mintmark sits to the right of Monticello. On war nickels, there’s a large P, D, or S mintmark sitting directly above Monticello’s dome. That large elevated mintmark is the definitive tell.
Circulated examples sell at or just above melt. Nicely uncirculated examples with the Full Steps designation, meaning the horizontal lines on Monticello’s entrance steps are complete and unbroken, bring $30 to $80 depending on the mint year. A good number of these turn up in old collections because families deliberately saved them during the war years.
1943 steel Lincoln cent
Image Credit: Heritage Auctions
In 1943, the government needed copper for ammunition and shell casings, so that year’s Lincoln cent was struck on zinc-coated steel instead. The result looks silver, sticks to a magnet, weighs less than a normal penny, and comes from a single dramatic year in American history. Over a billion were minted, which is why they’re common.
A circulated 1943 steel cent with rust or discoloration is worth a few cents above face value. A bright uncirculated example with intact zinc coating is worth $5 to $30 in gem grades, considerably more in the highest certified grades.
What matters much more: a 1943 penny that does not stick to a magnet is potentially a genuine bronze transitional error, one of the rarest and most valuable Lincoln cents in existence. Real copper 1943 cents number fewer than 20 known examples and are worth hundreds of thousands of dollars in any condition. If you find a 1943-dated penny that a magnet won’t attract, do not clean it, and do not try to sell it before having it authenticated by PCGS or NGC. Most “copper” 1943 cents are fakes made by copper-plating steel ones, but genuine examples exist and the authentication test is simple.
1957 blue seal silver certificate
Image Credit: Heritage Auctions
Before 1964, the standard $1 bill was a silver certificate, a note the Treasury was legally obligated to exchange for silver on demand. The blue seal on the front and the words “Silver Certificate” across the top are the identifiers. The 1957 series is the most common version you’ll encounter.
A circulated 1957 silver certificate in average condition is worth $1.25 to $4 depending on the specific series letter and how well preserved it is. Crisp uncirculated examples bring $6 to $15. Star note versions, identified by a small star symbol at the end of the serial number, are worth $8 to $45 in good condition. The 1935 series predates the 1957 and generally brings a bit more in equivalent condition. Earlier small-size silver certificates in the $5 and $10 denominations are more collectible still.
Not a life-changing find, but a genuine premium over face value, and they show up regularly in old wallets, inherited envelopes, and boxes of loose bills from estates. Anything with a blue seal is worth setting aside.
1963 red seal $2 legal tender note
Image Credit: Heritage Auctions
The 1963 $2 bill carries a red seal and red serial numbers, the identifiers of a United States Note, a type of government-issued legal tender distinct from today’s Federal Reserve Notes. Production of the $2 US Note stopped in 1966, and when the denomination was revived in 1976, it returned as a Federal Reserve Note with a green seal. The red seal $2 is genuinely a different category of currency.
In circulated condition, a 1963 or 1963A $2 bill is worth $8 to $16, with crisp uncirculated examples reaching $25 to $50. Star note versions command $30 to $150. The 1928 red seal $2 bills, the earliest small-size version of the denomination, bring $10 to $30 in average condition and significantly more in nice uncirculated grades.
Not all old $2 bills are valuable, but the red seal versions from 1928 through 1963 consistently bring a genuine premium over face, and they’re easy to identify on sight. If you find one while sorting through old currency, it goes in the keeper pile, not the spending pile.
Most circulated 1976 $2 bills are worth $2. A crisp uncirculated example might bring $5 to $15. Bills that collectors had stamped at post offices on April 13, 1976, the first day of issue, with a cancellation mark across the attached postage stamp, are worth $10 to $20.
Where things get interesting: star notes from the Kansas City Federal Reserve district (the “J” letter on the front) had the lowest print run of any district that year, and those bring $25 to $100 depending on condition. A bill with a serial number below 100 is worth several hundred dollars. A solid repeating number can bring more. If you have a plain circulated 1976 $2 with an ordinary serial number, it’s worth exactly $2. Check the serial number before getting your hopes up.
1935A $1 WWII Hawaii overprint silver certificate
Image Credit: Heritage Auctions
After Pearl Harbor in December 1941, the US government feared a Japanese invasion of Hawaii. The solution: issue special $1 bills for use in Hawaii only, overprinted with the word HAWAII in large letters on both sides of the note, with brown seals and serial numbers instead of the usual blue. If Hawaii were captured, the Treasury could immediately declare those distinctively marked notes worthless, preventing Japan from using seized American cash as a functioning currency.
The 1935A $1 version is the most common of the four denominations (there were also $5, $10, and $20 versions) and brings about $20 in average circulated condition, with crisp uncirculated examples reaching $75 to $100. Star note versions are rarer and considerably more sought after. Higher denominations bring more. They surface in estate lots with some regularity, particularly from families with military connections to the Pacific, and they’re one of the most historically compelling pieces in all of American paper money.
Low print run star notes
Image Credit: Heritage Auctions
Every time a bill is damaged or misprinted during production, the Bureau of Engraving and Printing replaces it with a star note, a bill with the same serial prefix but a star symbol at the end of the number instead of a letter. The replacement is necessary because no two bills can legally share an identical serial number.
Star notes are printed in batches called runs, and that run size determines scarcity. Most modern star notes come from standard runs of 3.2 million, which makes them common and worth face value in any condition. But sometimes the BEP only needs a small number of replacements for a short print run of a particular series, and star notes from runs of 640,000 or fewer can be worth two to fifty times face value depending on denomination and condition.
A crisp $1 star note from a 640,000-print run can bring $10 to $50. A $100 star from an unusually scarce run is worth multiples of its face value. Checking is free: the Bureau of Engraving and Printing publishes its star note production records, and free lookup tools at sites like Look Up Star Note or My Currency Collection let you enter your denomination, series year, and serial number to find the production run in seconds. Most of what you’ll find is common. Occasionally, it won’t be.
Fancy serial number bills
Image Credit: Heritage Auctions
Collectors pay premiums for bills with serial numbers that form unusual patterns, and the market for them is active enough that a $1 bill with the right combination of digits can sell for hundreds.
The most sought-after types are solid serials (all eight digits identical, like 77777777), ascending or descending ladders (12345678 or 87654321), and radar notes (palindromes that read the same forwards and backwards, like 12344321). Radar notes are accessible enough that a circulated $1 radar can bring $25 to $100 in nice condition. A solid serial on any denomination in gem uncirculated condition commands several hundred dollars or more. Very low serial numbers, particularly those below 100, bring serious premiums regardless of denomination.
Checking takes thirty seconds. Pull out your wallet. Look at the eight digits in the middle of the serial number, ignoring the prefix and suffix letters. Does it form any pattern? Free serial number checkers at SerialWorth.com and FancySerialNumberPriceGuide.com will analyze the pattern and give you a ballpark value range. The overwhelming majority of bills check out as ordinary. Every now and then, one doesn’t.
Error notes with offset printing or gutter folds
Image Credit: Heritage Auctions
The Bureau of Engraving and Printing processes billions of notes annually with extraordinary consistency. When something goes wrong and a misprinted bill gets through quality control into circulation, it becomes a collectible because it’s not supposed to exist.
The most common findable errors are gutter folds, where the paper folded slightly before printing, leaving a blank white stripe across the note where the ink never reached, and offset printing, where one side’s design partially transferred onto the other. A complete face-to-back offset can exceed $1,000. A severe gutter fold or dramatic miscut showing partial design from an adjacent note is worth several hundred. Minor misalignments add a modest premium.
Authentication matters for anything substantial. A chemically stripped bill can mimic a missing print error, which is why PMG grading makes a meaningful difference for error notes worth over $100. The errors worth most in this category are mechanically obvious ones: a visible fold or crease that was present when the note was printed (meaning it’s part of the paper, not damage from handling), or a dramatic ink transfer that’s clearly structural rather than a stain. If you find a bill that looks like a production mistake rather than wear, it’s worth a quick comparison against error note databases before you spend it.
1972 doubled die Lincoln cent
Image Credit: Heritage Auctions
The 1955 doubled die gets all the attention, but the 1972 version is significantly more accessible and still brings a real premium. In 1972, a Philadelphia Mint working die received a second hub impression at a slightly rotated angle, producing visible doubling on the date, the motto IN GOD WE TRUST, and the word LIBERTY. About ten varieties are known; the major Type 1 is the one with obvious spread visible to the naked eye.
Circulated examples in fine to extra fine condition bring $75 to $250 depending on how well the doubling shows. Uncirculated red examples in gem grades push to $500 to $1,500. A few thousand are estimated to exist, mostly in circulated grades, and they surface in coin dealer stock, old coin rolls, and estate lots more often than you’d expect.
The main authentication challenge: machine doubling is extremely common on 1972 cents and produces a flat, shelf-like appearance on the letters and date that looks superficially similar but is worthless. Genuine doubled die doubling is rounded and shows clear separation with distinct secondary elements. On the major 1972 variety, the doubling is strong enough that the difference between the real thing and machine doubling is visible without much magnification. If you’re not certain, PCGS and NGC will authenticate it.
2005-D speared bison Jefferson nickel
Image Credit: Heritage Auctions
In 2005, the US Mint brought back the bison reverse for a one-year commemorative design. At Denver, some coins were struck from a die with a significant gouge running through it, creating a raised line that looks exactly like a spear piercing straight through the bison’s body from back to belly. These became the Speared Bison variety.
The raised line is the key diagnostic: a genuine Speared Bison has a raised mark above the coin’s surface because it came from a damaged die. A scratch from post-mint damage would be incused. Circulated examples in good shape bring $30 to $60. Mint state coins push to $75 to $700 depending on grade. The record for a top-certified example sits at $2,650.
This is one of the better modern cherrypicking opportunities in coins because the error is visible without magnification. Look at the reverse of any 2005-D bison nickel and check for a raised line running through the animal’s midsection. Most will be clean. The ones with the spear are not subtle once you know what you’re looking for, and coin dealers will recognize it immediately.
1982 no-P Roosevelt dime
Image Credit: Heritage Auctions
Since 1980, Roosevelt dimes from Philadelphia have carried a small “P” mintmark on the obverse. In 1982, some working dies were prepared without the “P” punch, creating dimes that look like pre-1980 issues but aren’t. The Mint also stopped producing annual collector sets that year, meaning most 1982 coins went straight into circulation without anyone saving them.
A circulated 1982 no-P dime in extra fine condition is worth $30 to $75. A gem uncirculated example with full torch bands commands $150 to $500. The highest certified grades have pushed toward $2,000. Two varieties exist: strong strike and weak strike. The strong strike is significantly more valuable.
To check a 1982 dime: look on the obverse just above the date for the “P” mintmark. If the date reads 1982 and there’s no “P” present, you have either a pre-1980 issue (before the Philadelphia mintmark was added) or the genuine 1982 error. Since no-P dimes from 1965 to 1979 are common and worth nothing beyond silver melt or face value, the only no-P dime with serious collector value is dated specifically 1982.
2004-D Wisconsin extra leaf quarter
Image Credit: Heritage Auctions
The Wisconsin state quarter shows a wheel of cheese and an ear of corn. On some coins from the Denver Mint’s 2004 run, an extra leaf appears on the corn stalk near the base. Two versions exist: the extra leaf high (the additional leaf points upward) and the extra leaf low (it points downward). Both are die gouges.
Circulated examples bring $50 to $200 depending on the version and how well preserved they are. Well-preserved mint state examples can reach $400 to $1,500. The estimated population of each variety runs between 20,000 and 50,000 coins, which means they show up regularly in dealer stock and estate lots.
Both varieties are recognized and labeled by PCGS and NGC, confirming they aren’t post-mint alterations. The extra leaf is visible with the naked eye on a decent specimen: look at the ear of corn on the reverse and check the lower husk area for an additional leaf that doesn’t appear on standard 2004-D Wisconsin quarters. A 2004-D Wisconsin quarter without the extra leaf is a normal coin worth 25 cents.
1955 doubled die Lincoln cent
Image Credit: Heritage Auctions
This is the famous one. In the spring of 1955, a Philadelphia Mint obverse die received two hub impressions at a slight misalignment. The result is a dramatic doubling visible without magnification on the date, the word LIBERTY, and the motto IN GOD WE TRUST. About 24,000 examples entered circulation, many distributed as change in cigarette vending machines across New England.
Even heavily worn examples bring $1,000 to $3,000 in the lower circulated grades. A solid extra fine to about uncirculated example is worth $2,500 to $5,000. Nice red uncirculated examples bring $10,000 to $20,000. Top-certified specimens are in a different league.
Fakes are the primary concern. Because the coin is famous, counterfeiting has been ongoing since the 1960s. The most common version involves a genuine 1955 cent with machine doubling, which is common and worthless, presented as the real thing. On a genuine 1955 doubled die, the secondary impressions are rounded and show clear, distinct separation. Machine doubling produces a flat, shelf-like secondary image with no real depth. Authentication by PCGS or NGC is non-negotiable before any purchase or sale. Do not buy a raw 1955 doubled die from a private seller.
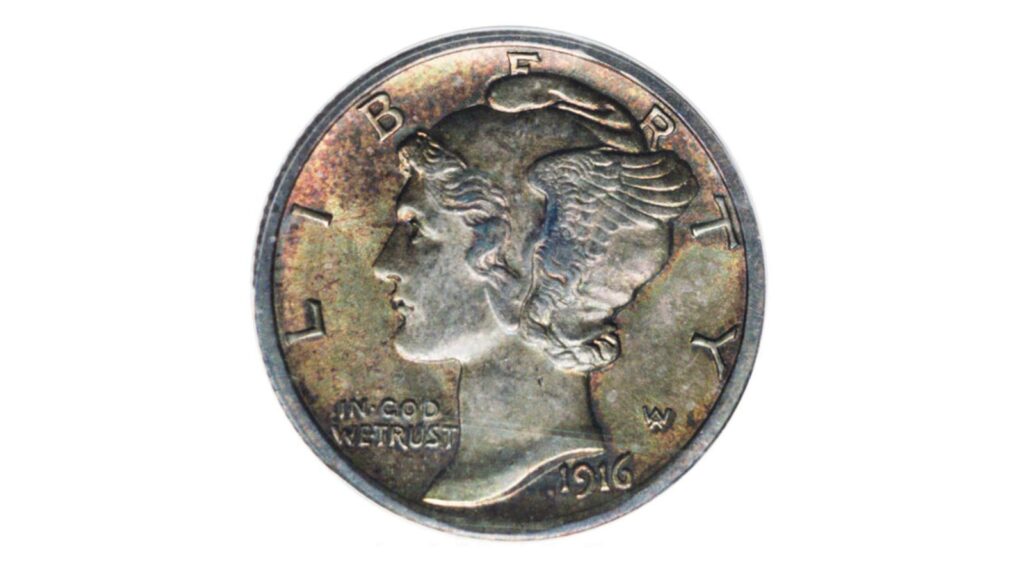
1916-D Mercury dime
Image Credit: Heritage Auctions
The Mercury dime, formally the Winged Liberty Head dime, ran from 1916 to 1945 and is considered one of the most beautiful coins the US Mint has ever produced. The Denver Mint struck only 264,000 in its first year, a tiny number that makes the 1916-D the key date of the entire series, comparable in significance to the 1909-S VDB Lincoln cent. Perhaps 10,000 survive today in all grades combined.
Even a heavily worn example in Good condition brings $700 to $1,200. A coin in Fine to Very Fine grade, showing honest circulation wear with the design still readable, commands $1,500 to $3,500. An About Uncirculated example pushes $5,000 to $10,000. Choice mint state pieces have sold for $20,000 and above.
Counterfeiting is a serious issue. The most common fake is a genuine 1916 Philadelphia dime with a “D” mintmark added, a process that’s been practiced since the 1950s. On a genuine 1916-D, the mintmark sits to the left of the fasces on the reverse at a specific height and has a particular shape consistent with period Denver Mint dies. Any soft, shallow, or off-center “D” is a red flag. This coin should only ever be purchased in a certified holder from PCGS, NGC, or CAC. No exceptions.
There is a blue glass mixing bowl sitting in a thrift store somewhere right now with a sticker on it that says $2. It is not labelled. Whoever priced it saw blue glass and priced it like blue glass. The person who buys it and knows what the mark on the base means will sell it for $150 to $300.
That bowl is the Hazel-Atlas Crisscross, made in the 1930s during the height of Depression-era kitchenware production. The pattern, the mark, and above all the color are what separate it from the dozens of similar-looking glass bowls that genuinely are worth nothing. Here is exactly what to look for.
The Crisscross pattern is exactly what it sounds like: a pressed grid of vertical and horizontal lines covering the exterior of the bowl, with a small square stamped at each intersection point. It is not painted on. It is molded directly into the glass, so the texture is raised and you can feel it under your fingers. Run your thumb across the outside of the bowl. If the crosshatch is a smooth print rather than a physical texture you can feel, it is not Crisscross.
The bowls were made in nesting sets of four, graduating in size from roughly 6 inches to just over 9 inches in diameter. A set of four is more valuable than a single bowl, but single bowls show up alone constantly and are worth identifying on their own merits. The Crisscross line also included butter dishes, refrigerator dishes, a reamer, a pitcher, and a creamer and sugar, all in the same pressed grid pattern, so the mixing bowls are not the only Crisscross pieces worth knowing.
The mark on the base
Image Credit: Karen’s Klassics via eBay
Flip the bowl over. You are looking for a capital H with a smaller A nested directly underneath it, positioned lower and centered, so the whole mark reads like a capital H with a small footstool beneath it. That is the Hazel-Atlas mark, and it confirms you have the right maker.
The mark most commonly confused with it belongs to Anchor Hocking, which also used an H in its early marks. The difference is unmistakable once you know it: the Anchor Hocking mark always includes an actual anchor symbol. If you see an anchor anywhere in the mark, it is Anchor Hocking, not Hazel-Atlas. No anchor means the H-over-A is worth investigating. Some Hazel-Atlas kitchenware from the 1930s was not marked at all, so the absence of a mark does not rule out Hazel-Atlas, but the presence of the H-over-A confirms it.
Color is the key: what yours is worth
Image Credit: cottontailantiques-4 via eBay
The Crisscross line was made in four colors, and they are not equal. Here is exactly where each one lands.
Cobalt blue
This is the one. Hazel-Atlas used its Ritz Blue glass for the Crisscross line, a slightly warm cobalt with a softness to it that looks different from harsher modern cobalt. In good, chip-free condition, cobalt Crisscross mixing bowls bring $150 to $300 or more depending on size, with the larger bowls at the higher end of the range. A complete set of four in cobalt is worth considerably more than four individual bowls. This is the color that collectors specifically search for, and the color most likely to be mispriced at a thrift store.
Pink
Pink Crisscross exists and has a collector following, but it brings noticeably less than cobalt. Individual pink bowls in clean condition typically trade in the $50 to $100 range. Still worth grabbing if the price is right, but do not expect cobalt numbers from a pink piece.
Green
The green pieces are worth knowing for a different reason: Hazel-Atlas green glass from this era contains uranium, which means it glows under a blacklight. This is not dangerous, and it actually helps you identify and date the glass. Green Crisscross bowls bring roughly similar amounts to pink, sometimes a bit less. Worth picking up, but not the prize.
Crystal (clear)
Crystal Crisscross is the most common color and brings the least. Clean individual crystal bowls sell for $20 to $50. A complete clear set in excellent condition is a pleasant find, but it is not going to change your day.
What kills the value
Image Credit: Karen’s Klassics via eBay
A chip anywhere on the rim drops the value sharply. Depression glass collectors are picky about condition, and even a small chip on an otherwise beautiful cobalt bowl will price it out of the top tier. Run your finger around the entire rim before buying or before getting excited about what you have.
Cloudiness is the other big issue. Glass that has been through a dishwasher dozens of times takes on a hazy, etched look that does not clean off. Hold the bowl up to the light. Clean cobalt Crisscross should be clear and jewel-like. Haziness means someone dishwashered it, and haziness is permanent. A cloudy cobalt bowl is still pretty, but it brings a fraction of what a clear one does.
Cracks anywhere in the glass are disqualifying. Hairlines reduce value severely. No serious buyer wants a cracked Depression glass bowl at any price.
Have you ever fallen into a pattern of mindlessly replenishing your wardrobe with cheap, fast fashion pieces, only for them to wear out irreparably after just a few uses? When we’re constantly chasing new trends, quality considerations sometimes go out of the window. However, if you break the trend-chasing cycle and turn your attention to high-quality basics, you’ll find that you can actually both improve your wardrobe and your finances in the long run. Here’s how:
At first glance, investing in expensive clothing in order to save money may seem counterintuitive. However, when you consider the fabric’s quality, the style’s longevity, and the product’s durability, you start to get a better understanding of how higher quality often means less expenditure in the long-term. For example, many styles of long dresses have been in fashion for decades on end, and are unlikely to go out of favor any time soon. The right long dress made with high-quality fabric and stitching could last you for an extremely long time without ever needing to be replaced.
The cost-per-wear mathematics
The maths of cost-per-wear (CPW) further illustrate the financial benefits of investing in high-quality fashion basics. You can find an item’s CPW by dividing its purchase cost by the number of times you wear it. So, a cheap top costing $20 that you wear ten times has a CPW of $2. However, a higher-quality top costing you $70 that lasts for 70 or more wears will have a CPW of $1 or less. High-quality basics, therefore, prove to be a lot more cost-effective over time.
Great value for your money
Price tags should not be the sole determinant of the value for your money. The cost of continual replacement adds up. An item that retains its quality, structure, and appearance for a long time is better value than a cheaper product that deteriorates rapidly and needs replacing. High-quality basics are usually made from superior materials, have better stitching and finish, and are often ethically produced, contributing to their overall value.
Saving the environment, too
Quality clothing is also environmentally friendly. Fast fashion contributes significantly to environmental degradation with high levels of waste, pollution, and carbon emissions. By switching our buying habits to high-quality, long-lasting garments, we contribute less to the pile-up of textile waste and thus help alleviate the severe environmental impact of the fashion industry.
Getting your basics right
A good place to start when putting together a high-quality, low-CPW wardrobe is with versatile, high-quality core pieces that can adapt to your style over time. Think well-fitted jeans in solid colors, a crisp white shirt, a little black dress, sturdy boots, and quality underwear. Paired with seasonal pieces for variety, these basics lay the groundwork for a stylish wardrobe that saves both money and effort and that can help prevent lifestyle creep from draining your bank.
Maintaining your quality basics
To truly save money with high-quality basics, proper care is very important. By treating your clothes correctly – washing at the correct temperature, not over-ironing, storing properly – these items will last longer and continue to look their best.
Conclusion
In the world of fashion, prudence and wisdom tell us that it’s about quality, not quantity. The major shift towards sustainability further substantiates the importance of investing in high-quality basics. Yes, they cost more upfront, but their durability, versatility, excellent cost-per-wear, and overall value for money significantly offset the initial expense. Besides, this conscious consumption is also a more ethical and environmentally friendly choice towards a cleaner and safer planet. In the bigger picture, it’s definitely beneficial to your wallet and our world to invest in high-quality basics – a win-win situation for all.
If you’ve ever thought about borrowing against the equity in your home, whether for a renovation, debt consolidation, or just having a financial cushion, you’ve probably also felt a little nervous about it. Your home is likely your biggest asset, and the idea of putting it on the line can feel like a leap.
What a lot of homeowners don’t realize is that depending on where you live, there may already be rules in place designed to keep that leap from turning into a fall. Some states have built-in protections that limit how much you can borrow, how often, and under what conditions, all aimed at making sure homeowners don’t accidentally over-extend themselves. Understanding what those protections look like, even if you’re not actively borrowing right now, is the kind of practical knowledge that helps you make better decisions later.
Home equity borrowing rules might seem like just another layer of red tape, but they exist for a real reason. In states with the strictest protections, the rules trace back to a simple goal: keeping families from losing their homes by borrowing more than they could realistically repay.
Before these protections existed, some homeowners found it possible to borrow against their home repeatedly, often more than the home was actually worth, which left them with little to no equity cushion if home values dropped or life threw a financial curveball. The rules that followed were designed to put guardrails around that, balancing access to home equity with long-term financial stability.
The result is a system that can feel more restrictive than borrowing in other states, but that restriction is doing a job. It’s protecting homeowners from themselves in moments when a big number on a loan offer might look more appealing than it should.
The rule that caps how much you can borrow
The most important protection to understand is a simple one: in states with strong home equity protections, you typically can’t borrow more than 80% of your home’s value, and that 80% includes any mortgage balance you still owe.
Here’s what that looks like in practice. Say your home is worth $450,000 and you still owe $200,000 on your mortgage. Your maximum borrowing limit, combining your existing mortgage and any new home equity loan, would be $160,000. That leaves $90,000 of equity that simply isn’t accessible through borrowing, no matter how the loan is structured.
That untouchable portion is the safety net. It means that even in a worst-case scenario, where home values dip or finances get tight, there’s a built-in cushion that hasn’t been borrowed against. For anyone researching a Texas HELOC loan, this 80% cap applies whether you’re looking at a lump-sum home equity loan or a line of credit, and it’s one of the first numbers worth understanding before you start comparing offers.
The other built-in protections worth knowing about
The 80% cap isn’t the only safeguard. A few other rules work together to slow down the borrowing process just enough to make sure it’s a considered decision rather than a rushed one.
One protection limits how often you can tap into your home’s equity, often to once every 12 months, even if you’ve already paid off a previous loan. This prevents a cycle of repeatedly borrowing against the same home in quick succession.
Another protection requires a mandatory waiting period before a home equity loan can close, often around 12 days, giving homeowners time to review the terms, ask questions, and back out if something doesn’t feel right. There’s typically also a short grace period after closing where the loan can still be cancelled without penalty.
Finally, in states with these protections, lenders are limited in what they can charge in fees, can’t require additional collateral beyond the home itself, and can’t penalize you for paying the loan off early. Each of these rules removes a way that borrowing could otherwise become more costly or more pressured than it needs to be.
What this means if you’re considering tapping your equity
If you’re a homeowner thinking about using your home’s equity, whether for a kitchen renovation, paying off higher-interest debt, or covering a major expense, these protections mean a few practical things for you.
First, your maximum borrowing amount will already be limited in a way that preserves some equity, so you don’t need to worry about a lender offering you more than is genuinely safe to take on. Second, you’ll have built-in time to review any loan offer carefully before committing, which is a good opportunity to compare a home equity loan against a HELOC and figure out which structure actually fits your situation.
It’s also worth asking your lender directly how these rules apply to your specific situation, since the exact numbers depend on your home’s appraised value and what you currently owe. A lender who can walk you through your 80% limit, your borrowing history, and your options clearly is one worth working with.
Why knowing this helps you borrow smarter
For budget-conscious homeowners, understanding these protections isn’t just about compliance. It’s about going into a borrowing decision with realistic expectations and a clearer sense of what’s actually available to you. Knowing that a portion of your equity is protected, that you have time to review any offer, and that certain costly practices are off the table can take some of the anxiety out of what can otherwise feel like an intimidating financial step.
The bottom line is that these rules aren’t there to make borrowing harder for the sake of it. They’re there to make sure that if you do decide to use your home’s equity, you’re doing it in a way that keeps your financial footing intact.
You could have worked the same job as a male colleague for the same number of years, put the same percentage into your 401(k), and still retire with about 39% less. The median retirement savings for women is $56,000. For men, it’s $92,000.
The gap isn’t there because women can’t save or invest. It’s structural, built into the way careers, caregiving, and compensation work in the United States. Most women don’t see the full picture until retirement is close and the math doesn’t look the way they expected.
Most of the causes have at least a partial counter. The ones you can actually do something about are worth understanding.
Lower earnings also mean a smaller Social Security benefit at retirement, because your benefit is calculated from your highest 35 years of wages. If you consistently earned less than a male peer over your working life, your retirement income will reflect that permanently, through every cost-of-living adjustment for the rest of your life.
The gap tends to widen for mothers specifically. It often starts or gets worse in the late 20s to early 30s, when the career patterns that affect lifetime earnings begin to diverge from men’s. Part-time switches, delayed promotions, and reduced hours to manage childcare compound quietly for years, with the full damage to retirement savings only becoming visible much later.
Caregiving years cost you twice
Image Credit: Shutterstock
A five-year career break to care for children or aging parents can reduce retirement savings by nearly $346,000. That figure captures only the direct savings loss, not the salary not earned, the promotions that don’t happen, or the employer contributions that sit in someone else’s account while yours earns nothing.
Women make up the majority of unpaid caregivers in the U.S. More than 455,000 women left the workforce in 2025, and of those who left voluntarily, 42% cited caregiving as the reason. A gap in paid employment is simultaneously a gap in Social Security credits, 401(k) contributions, and years of compound growth that simply disappear.
The thing that stings about caregiving breaks is that most women intend for them to be temporary. Often they are. But the return salary is typically lower than what was left behind, and the lost growth in the accounts that sat unfunded during those years doesn’t come back.
No 401(k) access means no employer match. Lower part-time wages also limit how much you can save even when an account is available. And reduced hours lower your Social Security earnings credits, shrinking your eventual monthly benefit too. Part-time work hits the retirement picture from every direction at once, without most people fully seeing it while it’s happening.
The SECURE 2.0 Act expanded 401(k) access for long-term part-time workers, which is a genuine step forward. But expanded access doesn’t create an employer match, and it doesn’t change what you’re earning while you’re there.
The practical consequence is a real risk of outliving your money, especially for anyone who retires early. A woman leaving work at 62 with $56,000 in savings faces categorically different math than a man retiring at the same age with $92,000. The numbers only diverge further as time goes on.
Healthcare costs compound the problem. Fidelity estimated in 2025 that a woman retiring that year would need around $180,000 to cover healthcare expenses in retirement, somewhat more than the overall individual average. And projected Social Security benefit shortfalls in 2032 would hit women harder than men, because elderly women are more likely to rely on those payments to cover basic living costs.
Your Social Security check reflects decades of lower pay
Image Credit: Shutterstock
Social Security calculates your benefit using your highest 35 years of earnings. If you took years out of the workforce, those get averaged in as zeros. If your salary was consistently lower than a male peer, your monthly check will be lower too, permanently.
Women aged 65 and older received an average Social Security benefit of $1,808 per month as of December 2024, compared to $2,215 for retired men the same age. That’s $407 per month less, or nearly $5,000 per year. For women who rely heavily on Social Security for housing and food, that shortfall is not abstract.
The gap is also cumulative. A lower monthly benefit paid out over 20 or more years of retirement represents a significant lifetime income difference. It’s the same structural disadvantage as the pay gap, just with a different label and a much longer tail. Checking your projected benefit at ssa.gov gives you a real number to plan around rather than guessing.
Women invest more cautiously than men
Image Credit: Towfiqu Barbhuiya
Only about 66% of women report actively investing, compared to 76% of men. Women also tend to hold more cash and conservative fixed-income investments relative to stocks, especially in the years approaching retirement. That instinct makes sense when you’re operating with less financial margin. It still costs you.
Cash and conservative bonds don’t grow fast enough to fund a 20-to-30-year retirement, and they don’t keep pace with inflation over time. A portfolio sitting mostly in money market accounts is quietly losing purchasing power every year, even when the dollar total looks stable. The returns that compound over decades are almost entirely the product of time in the market, not money on the sidelines.
The longer life expectancy women have is actually an argument for staying in equities longer, not for moving out of them earlier. Women statistically have more years for compound growth to work. Their investment allocations often don’t reflect that.
Negotiate your salary, every time
Image Credit: Shutterstock
The pay gap starts at the first offer and compounds at every raise cycle for the rest of your career. Women who don’t negotiate a starting salary typically earn tens of thousands of dollars less over their working lives than those who do, because every subsequent raise is calculated as a percentage of a lower base.
Research the real pay range before any negotiation. The Bureau of Labor Statistics Occupational Outlook Handbook has salary data by occupation, and platforms like Glassdoor and LinkedIn salary tools have market rates by job title and location. Come in with a specific number, not a range. Giving a range almost always results in landing at the lower end.
If you’re already in a role, ask for a salary review and bring documentation to support your case: market comps, expanded responsibilities, measurable contributions. You can’t recover the money you didn’t negotiate for in past years, but every raise from here compounds on a higher starting number.
Capture your employer’s full 401(k) match first
Image Credit: Shutterstock
An employer match is the closest thing to a guaranteed return that exists in retirement saving. If your employer matches 4% of your salary and you’re contributing 2%, you’re leaving part of your compensation on the table every single pay period. Every year you don’t capture the full match is money you’ve permanently declined.
The 401(k) contribution limit for 2026 is $24,500. Most people can’t max that out, and that’s fine. The priority is contributing at least enough to capture the full employer match first, then putting more in above that whenever your budget allows. Even an automatic 1% increase compounds significantly over a long career.
If your plan offers automatic escalation, where your contribution rate goes up by 1% each year, turn it on. Most people barely notice the difference in their take-home pay, and the difference in retirement savings over 20 years is not small. Check your plan enrollment documents or ask HR to confirm the option is available to you.
Keep contributing during career gaps
Image Credit: Getty Images via Unsplash
If you leave paid employment, you lose access to a 401(k). But if you have a spouse who is still working, you can fund a spousal IRA using their income. The 2026 IRA contribution limit is $7,500, with a catch-up contribution of $1,100 for people 50 and older, for a total of $8,600.
A spousal IRA keeps your retirement savings growing during years when your own earnings are zero. It means you’ll return to work with an account of your own rather than starting from nothing. Even modest, consistent contributions during a break compound meaningfully over time, and the tax-deferred growth continues uninterrupted.
If you’re doing any freelance or self-employment work during a career gap, a SEP-IRA lets you contribute up to 25% of net self-employment income. When you return to full-time work, re-enroll in your employer’s plan immediately and capture the full match from day one. Don’t wait for the next open enrollment window.
Think carefully before claiming Social Security early
For women, who tend to live longer than men, the math on delaying often pays off more strongly. Waiting until 70 rather than filing at 62 can result in a monthly benefit that’s roughly 77% higher, paid out over more years. Whether that’s the right call depends on your health, other income sources, and whether you have the financial cushion to cover expenses during the delay years.
If you’re married or were previously married, Social Security claiming is a household-level decision. In many cases, the higher earner delaying to 70 maximizes both the household benefit and the survivor benefit the lower earner would receive later. Running the actual numbers for your specific situation matters more than following a general rule.
Use catch-up contributions once you turn 50
Image Credit: Shutterstock
At 50, the IRS allows extra contributions to retirement accounts above the standard annual limits. In 2026, that’s an additional $8,000 in a 401(k), bringing the total to $32,500. For IRAs, the catch-up adds $1,100, for a total of $8,600. If you took career breaks or spent years contributing less than you wanted to, these provisions exist precisely for that situation.
Catch-up contributions are still tax-deferred, meaning no tax hit until you withdraw in retirement. They’re also available regardless of whether you’ve ever maxed out your contributions in previous years. You don’t have to have been a disciplined saver for decades to use them now.
At 60, the rules get even more generous. SECURE 2.0 created a super catch-up for people aged 60 through 63: up to $11,250 in additional 401(k) contributions per year, for a total of $35,750. If those years coincide with your peak earnings, they’re among the most powerful retirement-building years available to you.
Check whether you qualify for a spousal or ex-spousal benefit
Image Credit: Shutterstock
If you’re married, you may be entitled to Social Security benefits based on your spouse’s earnings record rather than your own, up to 50% of their benefit at full retirement age. If that amount is higher than your own earned benefit, Social Security pays the higher of the two automatically.
If you were married for at least 10 years before divorcing, you may still qualify for a benefit based on your ex-spouse’s record. You need to be at least 62, currently unmarried, and divorced for at least two years. The benefit can be up to 50% of their full retirement amount. Your ex doesn’t need to know you’re claiming, it doesn’t reduce their benefit, and it doesn’t affect any other ex-spouse who may be claiming on the same record.
A lot of divorced women don’t know this option exists, or assume it doesn’t apply because the marriage ended 20 or 30 years ago. The 10-year rule has no expiration date on the marriage side. Check your eligibility directly at ssa.gov if there’s any chance you qualify.
Bottom line
Image Credit: Shutterstock
The gap is real and the causes are structural. Most of them have at least a partial counter, and the earlier you start working the problem, the more ground you can close.